Subpath Analysis
Heteromotility’s feature quantification tool may also be applied to subpaths within the full time series. This is useful to quantify motility state transitions within individual cells.
Subpath Feature Extraction
Subpath analysis is performed using the --detailedbalance CLI flag in the
heteromotility tool. The argument following --detailedbalance is an
integer specifying the smallest length \(\tau\) of each subpath to
analyze. heteromotility will calculate features for all subpaths between
this argument and T = total_length//2. This behavior can be suppresed by
supplying a maximum subpath size to consider with --dbmax.
Here, `--detailedbalance 20 --dbmax 20 specifies analysis of only subpaths
exactly \(\tau = 20\) time units in length.
heteromotility demo/ --tracksX demo/rw_x.csv --tracksY demo/rw_y.csv --detailedbalance 20 --dbmax 20
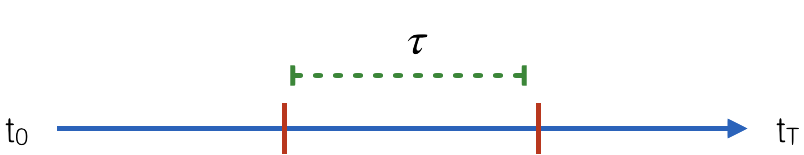
By default, heteromotility splits paths without any overlap, and places them
directly adjacent to one another in the time series.
Default Path Splitting Behavior
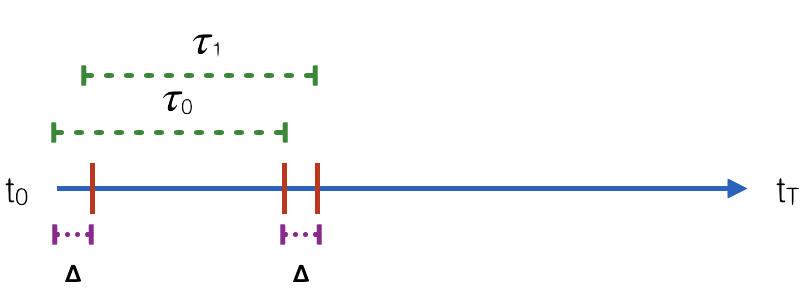
heteromotility also supports the use of sliding windows, splitting the full length
track into paths that differ only by a stride \(\Delta\). This behavior is invoked with the
--sliding_window flag, which specifies the size of the stride \(\Delta\) with an integer.
Here, --detailedbalance 20 --dbmax 20 --sliding_window 3 specifies analysis of subpaths
length \(\tau = 20\) with stride \(\Delta = 3\).
heteromotility demo/ \
  --tracksX demo/rw_x.csv --tracksY demo/rw_y.csv \
  --detailedbalance 20 \
  --dbmax 20 \
  --sliding_window 3
Sliding Window Path Splitting Behavior
Output Data Format
Output statistics are saved in motility_statistics_split_TAU.csv, where TAU is the size
of subpaths analyzed. The CSV has the same format as the static analysis export, with one key difference.
The cell_id column will now specify unique cell_ids as integers, as well
as the order of subpaths for each cell, separated by -.
For instance, for a path with total length T = 80, analysed with
subpaths length \(tau = 20\), the cell_ids column would appear as
follows:
cell_ids ...
obj0-0 ...
obj0-1 ...
obj0-2 ...
obj0-3 ...
obj1-1 ...
obj1-2 ...
...
In this example, statistics associated with 0-0 are from the first subpath
(0) of the first tracked cell 0. Statistics associated with 0-1 are
from the second subpath (1) of the same cell 0, and so on.